Computer Chronicles Revisited 59 — TellStar, Halley, and the Lick Observatory
In 1705, Oxford geometry professor Edmond Halley published a paper, A Synopsis of the Astronomy of Comets, which proposed that comets observed from Earth in 1531, 1607, and 1682 were in fact the same comet. Based on his calculations, Halley proposed the comet would be visible from Earth roughly every 75 years, with the next appearance expected in 1758. He never lived to see it, having died in 1741, but this prediction proved correct. Now known as Halley’s Comet (or Comet Halley), the celestial object’s most recent Earth appearance occurred in February 1986.
This next Computer Chronicles episode, which aired that same month, focused on astronomy software. There was something of Halley’s Comet-fueled “boom” in this niche of the software market, with roughly two dozen programs available to consumers. Given that astronomy largely involves performing intricate calculations, as demonstrated by Halley’s original paper, even the modest home computers of this era were capable of aiding amateur astronomers in their efforts to learn more about the galaxy.
Stewart Cheifet and Gary Kildall opened the program by demonstrating one of the many Comet Halley-themed programs available, this one actually titled Comet Halley for the Macintosh by Great Wave Software. Cheifet explained the software helped locate the titular comet in the sky. The program could also run in “auto mode” and show the comet’s movement from day-to-day.
Cheifet said there seemed to be a high correlation between amateur astronomers and computer hobbyists. He asked Kildall if he was ever into astronomy. Kildall noted that he previously taught marine navigation at his grandfather’s seamenship school in Seattle many years before starting Digital Research. In that role he regularly used tables, logarithms, and “a lot of addition and subtraction” to chart locations by examining the locations of stars. He said today you just needed to use a little navigation calculator–or if you were really lazy, you could just push a button on a satellite receiver.
Lick Observatory Astronomers “Swamped” by Computer-Generated Data
Wendy Woods presented a remote report from the Lick Observatory near San Jose, California. Woods said the observatory dated back to the late 19th century, when its “beautiful mountaintop domes” were constructed in the wilderness with the help of wagon teams and the simplest of machinery.
While the domes still housed some of the original equipment, Woods said, the operation of the observatory’s telescopes had changed dramatically. Lick’s C. Donald Shane reflector telescope was operated by–and fed data to–a computer. Its movements were orchestrated by a program that determined where to aim the telescope and compensated for the Earth’s movement. The telescope’s 10-foot-wide mirror was the source of its impressive light-gathering power, but its final output had changed. Instead of an eyepiece and a photographic plate, charged couple device (CCD) cameras could detect levels of brightness with unmatched sensitivity.
Burt Jones, the observatory’s associate director, told Woods that he’d recently been taking CCD images that contained roughly 2 million bits of information per image. Over the course of an evening, the computer would take 20 to 30 such images.
Woods noted that computers had given astronomers greater control to sift through the dense matrix of light points and analyze objects selectively. For example, overlays of false color could help Halley’s Comet appear more prominently. The astronomer positioned the telescope remotely by matching a position on the CCD array to absolute coordinates in the sky. The CCD could then record bright and faint objects in the same image thanks to its quick exposure time. Finally, astronomers could more easily isolate an object by separating it from the surrounding light emissions and reflections.
In fact, Woods said, to some researchers the density of information available today taxed our ability to absorb it. Jones said that as an observational astronomer, he found that data gathering was now more efficient by a factor of 10 or even 100 versus when he entered the field 20 years ago. Indeed, he said astronomers today were “swamped” with data because of computers.
“Novice” Astronomers Benefit from PC Software
Robin Raskin and Evan Scharf joined Cheifet and Kildall for the first studio round table. Raskin was a contributing editor with Family Computing Magazine, where she’d recently authored a feature story comparing astronomy software available for home computers. Scharf was a Colorado-based amateur astronomer and professional software developer who created the astronomy program TellStar.
Kildall noted that personal computers seemed like a “natural fit” for astronomy. He asked Raskin about the available astronomy software on the market. Raskin said the market in this area was “very exciting.” She noted she actually started her survey two years earlier, in 1984, but at the time there was nothing available for the “novice.” Now, thanks to interactive graphics, a home computer could provide a graphical view of a constellation or planet on the screen. The novice could then take that information and use it to locate the same objects in the real world (with a little more knowledge).
Kildall asked if “novices” meant students or just amateur astronomers. She said students could definitely use this software. Amateur astronomers could go further and look at some of the coordinate information and do less of the mathematical interpolation. But she said families that had been using computers for household chores could now sit down for the first time–especially with Halley’s Comet approaching–and have a way to learn about astronomy.
Kildall turned to Scharf and asked him to demonstrate TellStar. Scharf said his program was for someone who knew nothing about astronomy and would like to look up in the sky and identify what was there. The user could input a location into TellStar, as well as any time and date between the years 1 and 3000. For this example, Scarf used San Francisco on March 10, 1982, at 4 a.m. (There was a syzygy–an alignment of the planets in the Solar system–on that date that some people believed heralded the end of the world.) Scharf said that in reality, that day simply allowed people to view six planets at the same time, lined up in a view only 90 degrees wide.
Scharf said that once TellStar had the basic information it would then perform the necessary calculations–accounting for things such as the Earth’s procession or “wobble”, inner and outer planet relationships, etc.–and present a graphical view from San Francisco looking due south at 90 degrees. Scharf added that TellStar could produce nine different views for each location: one for each of the eight points of the compass and a ninth, overhead view. He noted the final graph showed not only the six planets, but also bright and dim stars as well as constellations. (Below is a recreation of the graph that Scharf produced, which I created by running TellStar in an emulator.)
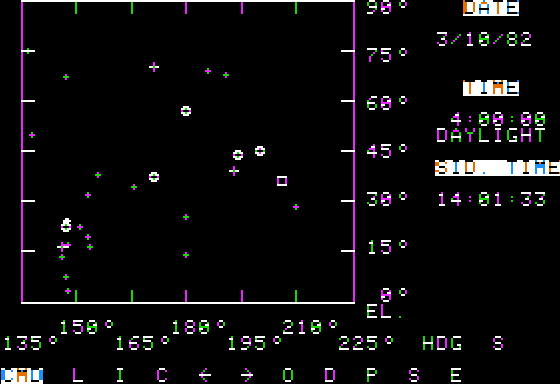
Cheifet asked if TellStar could actually help people identify specific constellations. Scharf said if the user pressed “C” on the graph screen, the software drew lines between the stars that made up any visible constellations. You could also press “I” to bring up a crosshair to select a specific object on the screen. A selection then brought up a separate information screen with that object’s celestial location, compass heading, and the times that it rises and sets.
Cheifet wanted to know how you could find a particular object ahead of time. Scharf reiterated you could enter any future date and time. The program could produce graphs for any location up to the year 3000. On the graph screen the user could press “L” and enter the name of an object, such as Saturn. This again produced a separate information screen. When the user returned to the graph, there would be a flashing cross-hair indicating the requested object’s location.
Kildall asked how many different objected were cataloged in TellStar. Scharf said there were three different star tables, and each one had about 250 objects, which represented the brightest objects you could see in the night sky. Cheifet asked about Halley’s Comet. Scharf said TellStar could locate the comet when it was close enough to Earth. He said he’d used the software himself to assist with his own viewings.
Cheifet turned back to Raskin and asked her what the software approach to astronomy did that you couldn’t get out of a book or the usual tables and numbers. Raskin said that software like Scharf’s gave people an “interactive planetarium,” which was handy if they didn’t live near a real planetarium, or they were in an area where the ambient light made it difficult to see objects in the sky. Additionally, books were static, while the stars were dynamic, and programs like TellStar moved along with them.
Raskin added that there was other software available that complemented TellStar, such as Journey to the Stars, which provided a tutorial on the concept of apparent motion, i.e., where you stood on the Earth and understood why the stars seemed to be moving. There were also bulletin board systems available for people who were interested in astronomy and had a modem.
Kildall asked if astronomy software was being used extensively in schools. Raskin said there are some software packages, such as one called Astronomy, that were starting to filter into the schools. Astronomy contained 10 different simulations that let students do things like witness the birth of a planet.
Cheifet asked Scharf how he translated the three dimensions of the sky into the two dimensions of a computer screen. Scharf said it was a bit of a challenge. Things that were close to the horizon up to about 45 degrees elevation looked normal. But when one was at higher elevations there were distortions. That’s why TellStar provided an overhead view to compensate for this distortion.
NASA Models Whole Universes
Wendy Woods returned for her second remote report, this time from NASA’s Ames Research Center in Mountain View, California. Woods said that until recently, scientists were confined to observing the stars as a series of snapshots through telescopes. Today, scientists saw space as a dynamic, moving universe, condensing time through computer modeling.
At the Ames Center, Woods explained, astrophysicists were exploring the “unseen,” employing data gathered from infrared satellites and space probes. The data was entered into sophisticated graphics workstations and then manipulated through a DEC VAX 11/785 minicomputer and NASA’s Cray supercomputer. The result was imagery of “universes colliding,” experiments solidly grounded in physics.
Dr. Bruce Smith of NASA told Woods that out of these experiments, scientists could extract certain characteristic properties they would then expect. This information was then given to the observational astronomers, who were told, “This is what we would expect in the formation of a galaxy.” He added the shapes of elliptical galaxies, in particular, were much more complicated than thought in the past.
Woods said the modeling experiments to date had proven that “halos” of matter, invisible through telescopes, exist throughout galaxies. Coming experiments would attempt to explain star formation and how planets were created. Smith told Woods that this interplay between observation and theory helped to make progress.
How Computers “Revolutionized” Astronomy
For the final segment, Dr. Bob Petersen and Dr. Steve Vogt joined Cheifet and Kildall in the studio. Peterson was an astronomy professor at the College of Marin and the founder of Starsoft. Vogt was an associate astronomer at the Lick Observatory.
Kildall asked Vogt if computers had really changed the popular image of an astronomer sitting by themselves looking through a telescope. Vogt said absolutely. The field of astronomy had been “totally revolutionized” by computers. Vogt said astronomers such as himself rarely looked through telescopes anymore. Personal computers were now used to control and point the telescope. Computers were also used to control the electronic instrumentation that did the actual observing, much like big television cameras. And larger computers were used to reduce and analyze data by creating simulations and models.
Kildall asked Vogt what kind of information he actually collected in his work. Vogt said they basically collected photons. He was an optical astronomer, so he collected light. He observed photons, counted them, and sorted them into their colors or polarizations.
Cheifet turned to Petersen and asked about Starsoft’s software called Halley. Petersen explained Halley was actually four small programs put together. It provided an animated sequence of Halley’s Comet. He demonstrated one part of the program, which allowed the user to input a range of dates–in this case 300 days from October 1, 1985–and see an animation of the comet’s movements from the vantage point of the Sun. He then showed a second demo, this time showing the comet’s path over a period of 95,000 days from January 1, 1945. (Petersen said 95,000 days matched the approximate length of Pluto’s orbit around the sun, so it provided a useful comparison with Halley’s Comet.) Petersen said Halley could also produce an Earth-based view of the comet’s path, and he demonstrated that as well.
Cheifet noted that while Halley produced approximations of the comet’s path, Vogt and his team at the Lick Observatory had actually taken pictures using their computers. Vogt described some footage from those pictures (see below). He said this represented a computerized image-intensified version of one night’s worth of data on Halley’s Comet. The data was obtained by astronomers Richard Stover and Burt Jones using a 40-inch telescope. Each frame was taken by a CCD, processed, and assembled by the computer into a color-enhanced image (see below). The colors were not real; they were simply representations of intensity, which helped the astronomers see detail and structure more quickly.
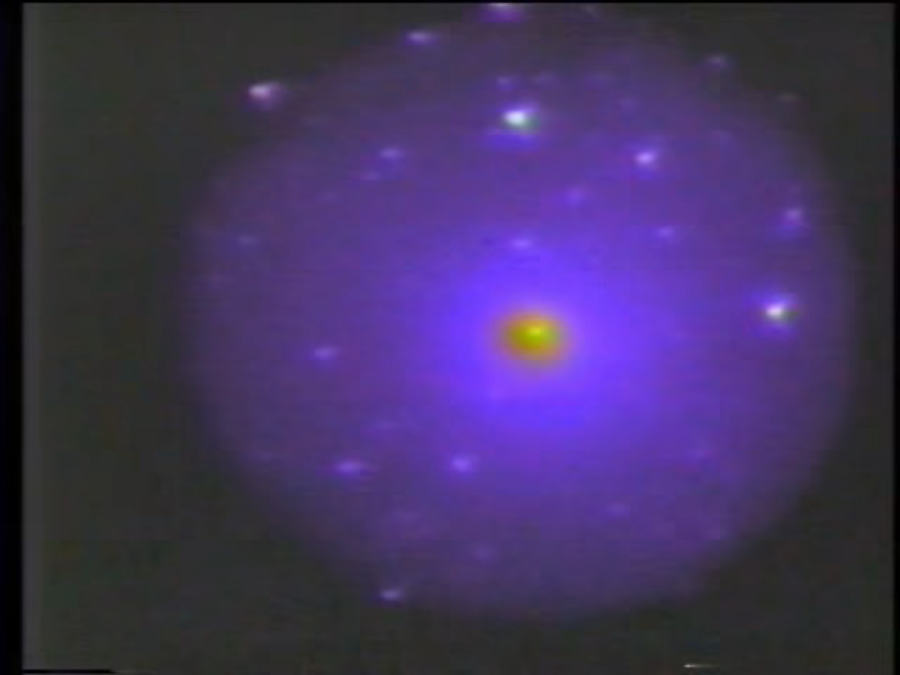
Cheifet clarified this was not an optical, filmed picture. It was really a television picture of the comet. Vogt said it was a “super-television picture with a super-sensitive television camera.”
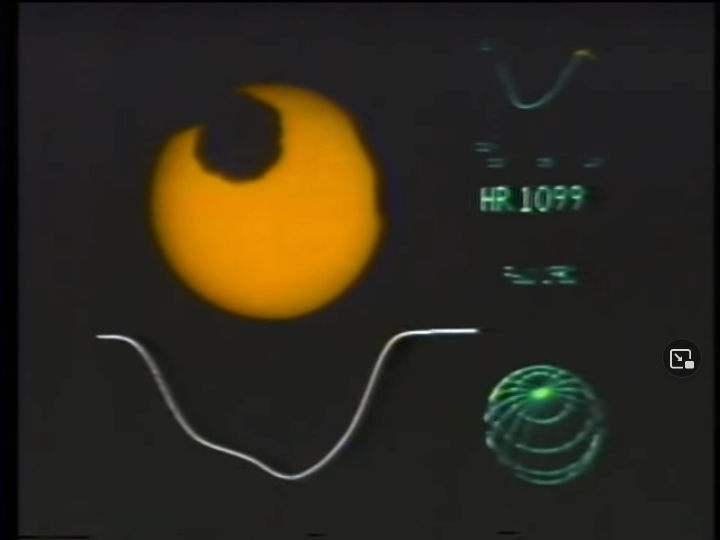
Vogt also showed some footage of a Doppler image of HR 1099, a binary star system about 116 light years from Earth (see below). You couldn’t see it as a physically differentiated star system from Earth. But using a variety of computerized techniques, it was possible to make Doppler images of the star and see dark “star spots.” The graph on the bottom was a spectral-line profile at a wavelength near the resonance absorption of a single atom.
Cheifet asked Vogt about the use of computers to search for radio waves and possible life in outer space. Vogt said one of the biggest efforts underway was the SETI program, which used very sophisticated hardware and software to scan the radio-frequency spectrum for signs of intelligent life. SETI’s high-speed computer systems could scan millions of channels at once.
Cheifet asked what kinds of astronomy tasks required something like a Cray supercomputer as opposed to a PC. Vogt said problems like the previously demonstrated Doppler imaging. That required a DEC VAX 11/780, which was reasonably well-suited to the task. Crays were generally used for simulations, like making a model of the inside of a star or the explosion of a supernova, which required billions of calculations.
Cheifet asked Petersen if he saw growing interest in computers among astronomy students. Petersen said yes, particularly due to the recent interest in Halley’s Comet from the media and the general public. He’d noticed “quite a bit of activity” around astronomy at his college as a result.
Osborne Called It Quits; Jobs Bought Expensive Computer from Lucas
Stewart Cheifet presented this week’s “Random Access,” which he recorded in February 1986.
- Computer retailer ComputerLand planned to introduce its own computer. The company was looking for a manufacturing partner in Asia to produce a ComputerLand-branded MS-DOS machine to compete with the Tandy 1000 and the Leading Edge Model D. Cheifet said the new ComputerLand machine could be on store shelves by June 1986.
- Osborne Computers declared bankruptcy for a second time. This time, the company would not try to reorganize. Instead, its assets would be liquidated. Osborne’s creditors declared the company in default after it failed to make payments on its $6 million in debts.
- Commodore posted a $53 million loss for the last quarter despite record sales of over $300 million. Cheifet noted that Commodore stock had been taking a beating but some analysts said the company would eventually be profitable.
- Steve Jobs bought Pixar, a company that made a high-end graphic computer, from filmmaker George Lucas. Cheifet said Pixar computers were designed to do 3D graphics for movies but had found a better market in the medical and military fields.
- IBM was the “new kid on the block” at a recent UNIX show in Anaheim, California, showing off the UNIX-based IBM RT PC. Cheifet said other UNIX vendors seemed to be moving towards IBM, with much talk of the need to “integrate” UNIX into the MS-DOS world.
- Paul Schindler reviewed 411 (Select Information Systems, $149), a program that indexed the text in every file on a computer’s hard disk. Schindler said 411 managed to produce an index that only took up 1-2 MB of disk space. There was also a built-in utility to index new files as they were created.
- New industry figures showed that just 10 companies accounted for 70 percent of the computer software business: Lotus, Microsoft, IBM, Ashton-Tate, Tandy, Apple, Digital Research, MicroPro, Multimate, and Software Publishing Corporation. Cheifet added that the top-20 selling programs accounted for 80 percent of the software business.
- President Ronald Reagan submitted a new budget to Congress, which included a “surprisingly high amount of money” for basic technology research, representing an increase of about 8 percent.
- Northwest Airlines purchased a $40,000 software package that told the company’s Sperry computer how many discount seats it should sell on a flight. The program analyzed 30 criteria, such as load factor and competition, and then set the number of cheap seats. Northwest officials claimed the upgrade of one discount seat a day per flight could generate an extra $12 million in revenue.
- Workers at the Federal Reserve Bank in San Francisco recently spent three days learning how to use their new computer system by working with a dummy program containing fake transactions. But when the system went live on Monday, the dummy program was still running, so the computer transferred $2 billion of funds to 19 banks that never requested the money. Cheifet said the error was discovered within a few hours, but two of the banks waited 24 hours before notifying the Fed of the mistake.
Evan Scharf (1943 - 1991)
Evan Scharf died on September 11, 1991, at the age of 48. Police found Scharf and his 10-year-old son, Robbie, stabbed to death in their Louisville, Colorado home. The police quickly identified a suspect in the double murder, who was a former neighbor of the Scharfs. The Rocky Mountain News reported the suspect was released from jail the previous night after posting bail on pending burglary charges. Police then found the suspect driving Scharf’s car a few hours later, which led to a check of the Scharfs’ home.
In 1992, the suspect–who I am choosing not to name here–was tried and convicted of both murders. The Boulder County district attorney elected not to seek the death penalty. A judge therefore sentenced the defendant to two consecutive life sentences. As of this writing, he is still in prison.
Scharf’s sister told the Rocky Mountain News that he’d “started a home-based computer software business several years ago to spend more time with Robbie.” (Scharf was apparently a single parent, although he was engaged at the time of his death.) During the 1970s, Scharf was the marketing manager for General Automation, a minicomputer manufacturer based in Anaheim, California. In 1981, he left General Automation to join Information Unlimited Software (IUS) in Berkeley as its vice president of marketing. IUS was perhaps best known for publishing EasyWriter, a word processing program for the IBM PC written by another former Chronicles guest, John Draper.
IUS also published the first version of Scharf’s TellStar in 1981. After Computer Associates acquired IUS in 1983, Scharf moved to Boulder County, Colorado, and self-published TellStar under his Scharf Software Systems for a short time. In 1985, another Boulder-based software company, Spectrum HoloByte, acquired the publication rights.
As Scharf alluded to in the episode, TellStar came in two versions. “Level 1” only included star tables for the northern hemisphere and originally retailed for $40. “Level 2” added the southern hemisphere and a list of roughly 100 additional astronomical objects and initially cost $80.
Rich Miser Opted to Fund Observatory Instead of (Literal) Pyramid Scheme
The Lick Observatory is named for James Lick. Born in Pennsylvania in 1796, Lick first gained notoriety as an organ and piano maker in New York City during the 1820s. After expanding his business into South America, Lick moved to California in 1848, where he lived the life of a miserly rich man until his death in 1876.
According to a history published by the Lick Observatory, it was George Davidson, an astronomer and president of the California Academy of Sciences, who approached Lick with the idea of donating some of his fortune to build a telescope. (Lick originally pondered building a giant pyramid in San Francisco as a monument to himself.) Two years before he died, Lick set aside $700,000 in a trust to fund the construction of an observatory.
An 1888 report in England’s Liverpool Mercury detailed the observatory’s lengthy construction process:
To find a site for such a building was no easy matter, for astronomers are not agreed as to what conditions are most favorable to stellar observation, but it was settled that Mount Hamilton, near San Jose, would be the best place for it. Mount Hamilton is 50 miles from San Francisco, and 15 miles, as the crow flies, from San Jose, which is the nearest railway station. The summit of this mount is 4,203 feet above sea level, and with one exception is the highest peak within a radius of 100 miles.
The authorities of Santa Clara county constructed a road from San Jose at a cost of $75,000, and all the steep gradients have been avoided by making this road 26 miles long. The mountain itself is a tough, feldspathic sandstone, and before the observatory could be erected they had to clear away about 72,000 tons of this rock.
The “real work” didn’t begin on the construction until 1870, the Mercury noted. And it was not officially completed until June 1888, when the observatory was transferred to the University of California, Berkeley, during the school’s commencement ceremony. (The observatory has been affiliated with the University of California, Santa Cruz, since the 1960s.) Professor Edward S. Holden, the Lick Observatory’s first director, wrote to the San Francisco Examiner in September 1888 that it took a month just to test the new telescope’s photographic lens:
Practically, we found ourselves confined to exposures of one second and less, and, therefore, to the moon as a subject.
Some sixty-five exquisite negatives were taken on twenty nights. Many, indeed most of them, are better than any previous pictures which I have seen.
At the time, the Lick Observatory’s 36-inch refractor telescope was reportedly the largest of its kind in the world. In 1959, the observatory commissioned a new, 120-inch reflector telescope, which was completed in 1959 and named after the observatory’s director at the time, C. Donald Shane. This was the telescope used to generate the images discussed in this Chronicles episode–and in fact, the Shane telescope still remains in use today.
Notes from the Random Access File
- This episode is available at the Internet Archive and has an original broadcast date of February 13, 1986.
- For the record, Robin Raskin’s Family Computing article found 23 different astronomy programs on the market in early 1986, including TellStar and Halley.
- Robin Raskin wrote for a number of publications during the 1980s and 1990s, including Family Computing, InfoWorld, and USA Today. She also served as editor in chief of Disney Publishing’s FamilyPC from 1993 to 2000. During the 2000s, she shifted into blogging and consulting. In 2010, Raskin founded Living in Digital Times (LIDT), a group that organized a number of conferences targeting “technophiles.” After selling LIDT to the Consumer Technology Association, Raskin started the Virtual Events Group in 2021.
- Burt Jones retired from the Lick Observatory in 2011. He first joined the observatory in 1970 and served as its associate director from 1996 until his retirement.
- Dr. Steven Vogt remains affiliated with the Lick Observatory and the University of California, Santa Cruz. In 2010, Vogt led a team that identified a potentially habitable planet outside of our solar system. The existence of the planet, called Gliese 581g, remains the subject of debate within the scientific community. According to a 2016 Space.com article by Elizabeth Howell, a rival team of astronomers based in Geneva, Switzerland, published a paper disputing the findings of the Vogt team, which “kicked off a flurry of publishing activity about 581g, sometimes also discussing the plausibility of other supposed planets in the system.”
- George Lucas’ sale of Pixar to Steve Jobs would make a big splash a decade later when the company released the first computer-animated film, Toy Story. But in 1986, Jobs viewed Pixar as a hardware company. The Pixar Image Computer initially sold for $122,000–or roughly the cost of 12 Apple Lisas.